Market analyst Dr. Cat (@DoctorCatX) has made a bold assertion, stating that XRP boasts the most robust chart in the crypto market. He highlighted specific dynamics within the Ichimoku Cloud that currently positions XRP favorably compared to Bitcoin and significant altcoins like Ethereum.
XRP: The Leading Chart
In a comparative analysis of XRP/USD versus BTC/USD on a weekly timeframe, Dr. Cat notes that XRP consistently displays a fully bullish structure within the Ichimoku framework. The weekly chart shows XRP maintaining its position above the Kijun-Sen (base line), while the Tenkan-Sen (conversion line) remains above both the price and the Kijun, illustrating a classic bullish setup. Priced at $2.09688, XRP has now held above the Kijun for several weeks without significant downturns.
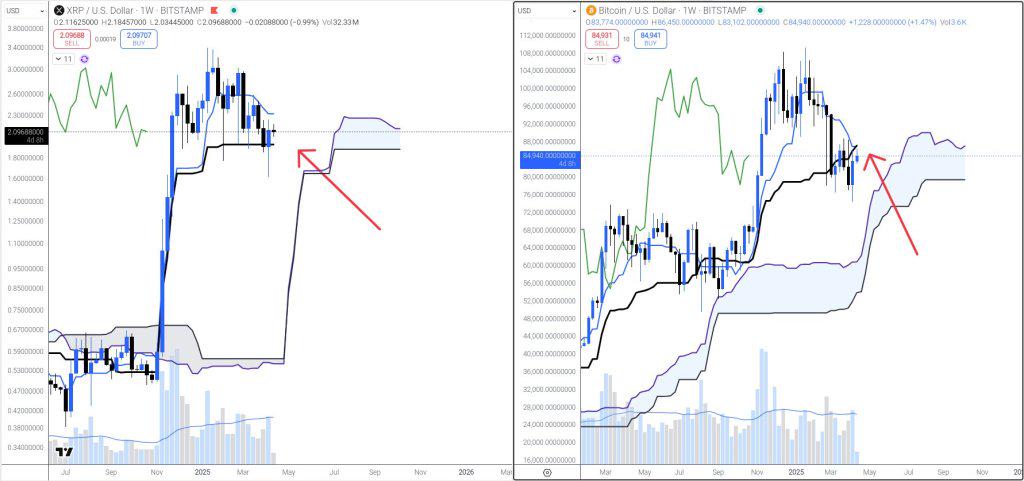
The Ichimoku cloud, as forecasted, reveals a sharply rising Senkō Span A, forming an upward-sloping top to the cloud that extends into May. Senkō Span B is comparatively lower and flat, contributing to the positive slope of the cloud. This configuration generally indicates a strong upward trend. Although exact numerical values for these lines are not marked on the chart, their shape and positioning confirm a bullish cloud structure, where Span A resides above Span B and is increasing. This formation is often indicative of strong continuation trends.
Bitcoin’s Weaker Position
In contrast, the weekly chart for BTC/USD reveals a weaker scenario. Despite Bitcoin trading at $84,940 and remaining above the Kumo, it has slipped below the Kijun-Sen, losing that key baseline over the last two candles. Additionally, the Tenkan-Sen has crossed below the Kijun-Sen, leading to a traditional bearish crossover. Dr. Cat mentions the significance of this crossover, noting that even if it turns out to be a false signal, it nonetheless represents a point scored for bears that must be addressed.
Market Insights from Dr. Cat
Dr. Cat provides further insight into the performance of various cryptocurrencies, stating: “Numerous altcoins, including ETH, are already experiencing bear market conditions on the weekly chart. Bitcoin faces challenges in its recovery efforts. However, XRP’s bullish position remains intact.” In response to speculation about future price points, with users predicting $0.80 retracements or immediate all-time highs, he stated: “By the end of May, the outlook should be much clearer.”
Dr. Cat also mentioned his medium-term price target for XRP of $4.50, suggesting the potential for a breakout that may lead to new all-time highs around $3.84. However, this anticipated movement is contingent on current bullish momentum being sustained.
XRP’s Dominance Over Ethereum
Further supporting XRP’s strengthening position is independent analyst Dom (@traderview2), who shared a historical performance heatmap comparing XRP to ETH on a monthly basis. His findings indicate that XRP has outperformed ETH for five consecutive months, entering a record-setting sixth month of relative gains.
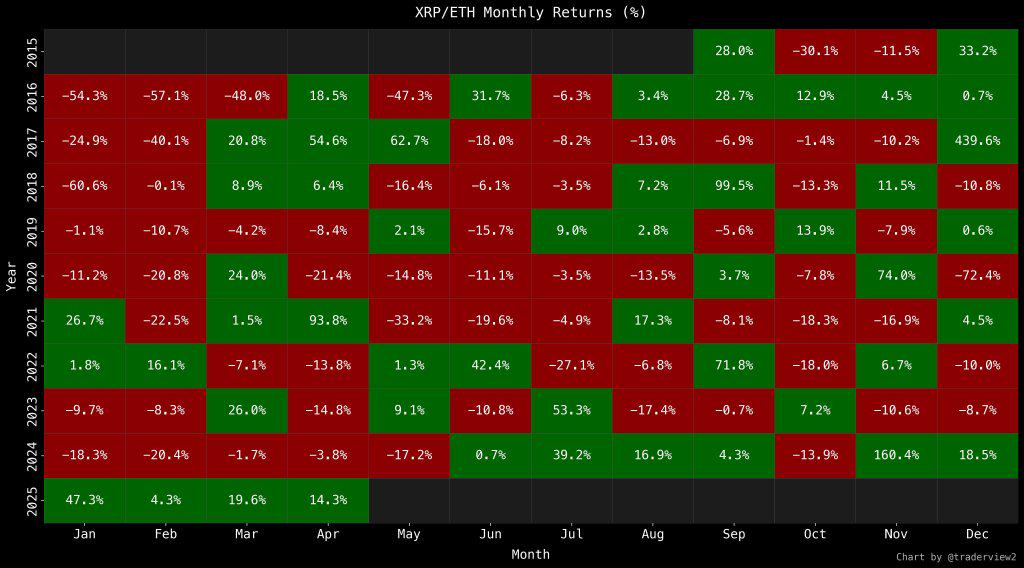
This outperformance commenced in November 2024, with XRP achieving a remarkable +160.4% relative gain against ETH, followed by +18.5% in December, +47.3% in January, +4.3% in February, +19.6% in March, and +14.3% this April. Before this streak, the longest record of outperformance was four months (June-September 2024), marking this current period as historically unprecedented. The cumulative gain over this timeframe exceeds +264%, signaling a substantial capital shift toward XRP not observed in previous market cycles.
While it remains uncertain whether XRP’s newfound strength will propel it to new heights, its chart structure currently stands unrivaled among major cryptocurrencies on the weekly scale. With a clearly bullish setup, an ascending cloud, and remarkable relative gains, Dr. Cat’s assessment remains firmly expressed: “XRP bulls continue to dominate the market.”
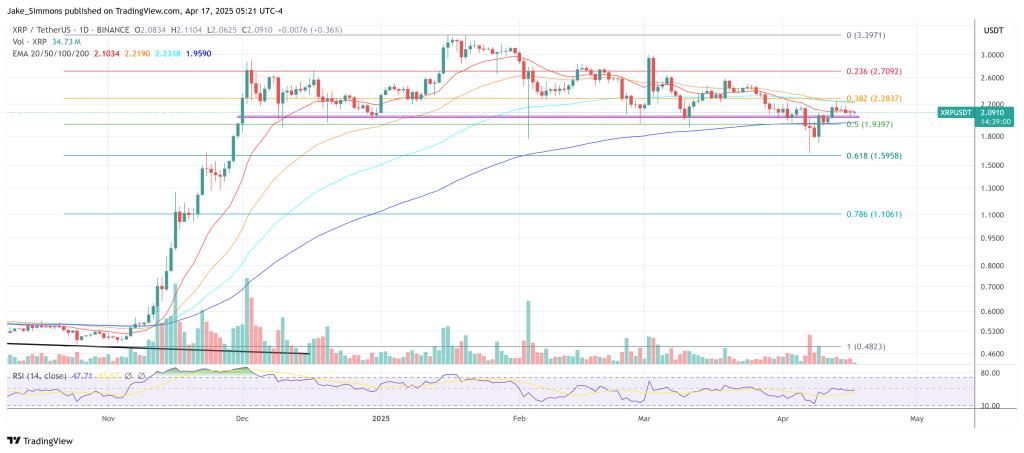
As of the latest update, XRP is trading at $2.09.