
XRP is gearing up for a significant technical showdown as it approaches the 26-day Exponential Moving Average, a pivotal resistance point. After recovering from recent lows around $1.96, XRP has been on a steady incline, currently trading at approximately $2.10. This momentum hints at the potential to break free from the descending wedge pattern that has restricted its movement for several months.
The position of the 26 EMA, situated in the $2.13 range, is particularly crucial in the current chart. Historically, this moving average has acted as a dynamic resistance level for XRP, with multiple rejections observed in the past months. A successful closure above this level could pave the way for a shift in short-term momentum, potentially targeting the next resistance at $2.20 and beyond.
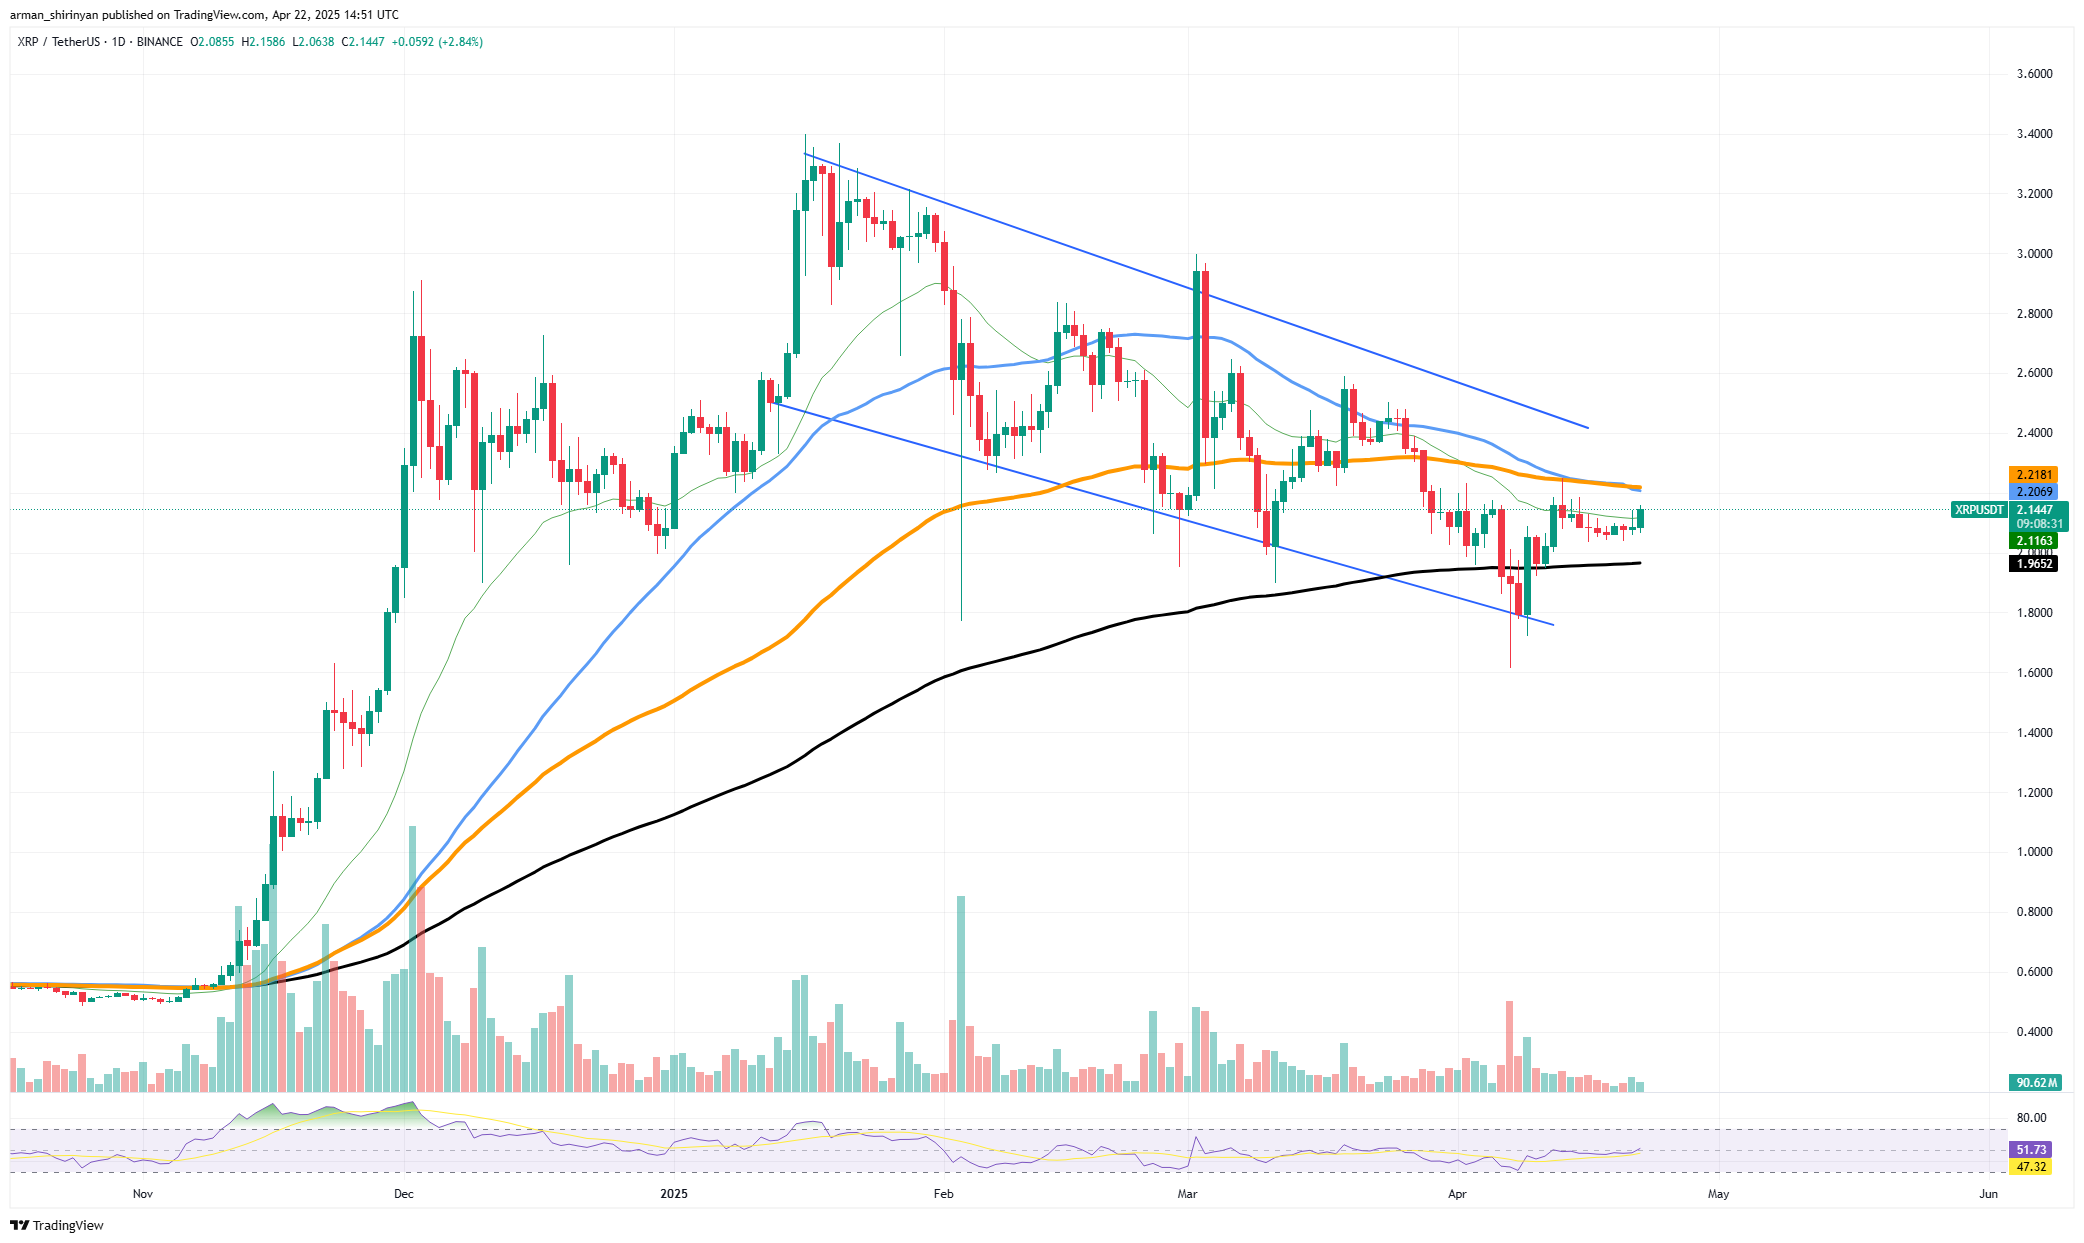
Despite a notable spike in early April, trading volume has remained relatively subdued, indicating a cautious sentiment among market participants. However, bullish movement remains plausible without reaching overbought conditions, as the RSI continues to rise, currently just short of neutral territory. Furthermore, XRP is demonstrating strength against the 50 and 100 EMAs, which are slightly converging and suggesting a potential trend reversal.
If XRP can successfully convert the 26 EMA into a support level, it could gain enough momentum to retest the wedge’s upper boundary, which lies around $2.40. As the overall market demonstrates recovery signs and prominent assets like Bitcoin and Ethereum gain traction, XRP’s prospects are looking better. Traders should monitor for a definitive move above the 26 EMA; a failure to do so may result in another consolidation phase, potentially sending XRP back toward its 200 EMA at approximately $1.96.
—
Bitcoin’s Bullish Prospects
Bitcoin is on a robust upward trajectory, with its recent breakout above key moving averages indicating that the $94,000 level may be the next target. Currently trading at $88,619 after a daily gain of 1.27%, Bitcoin has successfully surpassed its 50 and 200 EMAs, fueling bullish momentum in the broader market.
This rally is particularly notable due to the lack of substantial resistance between the current price and the next significant psychological and technical barrier at $94,000. In these areas where price action has yet to establish considerable barriers, Bitcoin has a tendency to fluctuate swiftly, setting the stage for momentum-driven price growth. Supporting this upward movement is a noticeable increase in trading volume.
The volume surge accompanying the breakout above $87,000 indicates decisive action from both institutional and retail buyers. With the RSI currently at 60, it has entered bullish territory and possesses room for further ascension without hitting overbought levels.
The critical turning point was the move above the 200 EMA, which had served as a formidable ceiling for over a month. This breach signifies a shift in market sentiment. If Bitcoin maintains this momentum and closes a few daily candles above $88,000, bullish traders are likely to set their sights on $94,000 as the next target for profit-taking.
—
Solana’s Short-Term Momentum
Solana has confirmed a short-term rally as price action approaches crucial resistance levels and key technical indicators signal bullish trends. Currently trading at $140, up 2.72% for the day, SOL has reclaimed this threshold, moving closer to a breakout zone and higher pricing areas. The crossing of the 26 EMA above the 50 EMA indicates increasing bullish momentum and a shift in short-term sentiment.

This crossover, backed by strong price performance, typically signals the beginning of an upward trend, and Solana has achieved this. SOL is nearing a confluence of significant resistance levels, with the next notable price ceiling at $150, a level that has previously acted as a peak in earlier rallies.
A critical technical barrier that could dictate whether Solana stalls or continues its ascent is the 100 EMA, positioned just above at $152. While a substantial increase in trading activity would further bolster the bullish narrative, current volume remains favorable for the rally. The RSI, now at 58.47, indicates there is ample room for growth before reaching overbought conditions. Additionally, SOL has surpassed a short-term bullish pennant structure, indicating continued upward momentum. However, it must decisively break above $150 and establish that level as support to sustain its rally.